

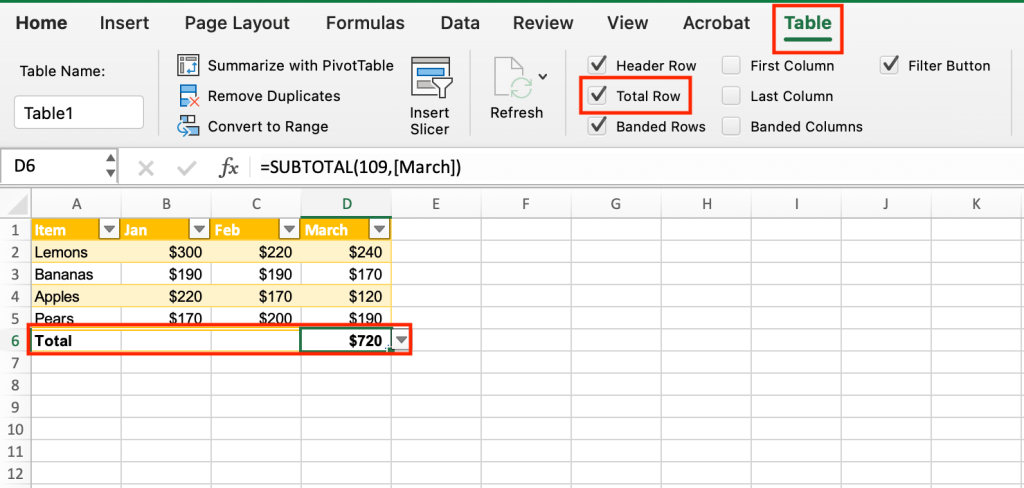

Add a Total row to the end of the table.
Shimon Brathwaite/IDG
What if you want to show the totals of the other columns in the table or show something other than sums in the last row? From the name, it would seem that you can only use the Total row for totals, but that is not true. If you click any cell in the last row, a downward-pointing triangle icon will appear next to it. Click the triangle and a drop-down menu will appear. You can calculate many different values, such as average, minimum, maximum, standard deviation, and more, and you can calculate each column.

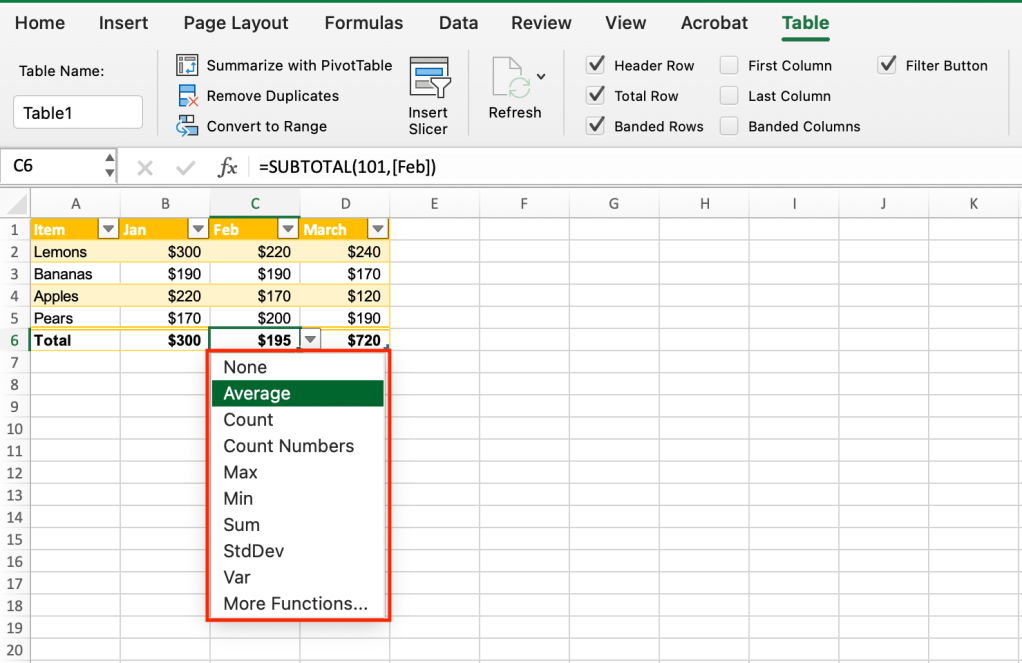
The Total row can perform many different types of calculations.
Shimon Brathwaite/IDG
If you choose to display calculations for multiple columns in a table, you will want to use the same calculation for each so they are consistent across the Total row. You'll also want to label the row appropriately. If you show averages in the Total row, for example, change “Total” to “Average” in the first cell.
How to sort and filter data in an Excel table
In addition to performing calculations, tables allow you to easily filter or sort data so that it can be presented the way you want.